AI Research Rankings 2022: Sputnik Moment for China?
Please subscribe to our Twitter if you’d like to follow our Deep Tech research. 🤖
Introduction
Welcome to AI Research Rankings, 2022 edition*. We analyzed publications at the two most prestigious AI research conferences leading up to 2022: International Conference on Machine Learning (ICML 2021) and Neural Information Processing Systems (NeurIPS 2021). Using conference proceedings, we went into each of the 3,523 accepted papers (1,184 papers at ICML and 2,339 papers at NeurIPS) and compiled a list of authors and their affiliated organizations, and then calculated the Publication Index for each organization (see “Methodology” section below). The most intuitive way to think of the Publication Index is from the point of view of full paper equivalents: Google’s Publication Index of 200 can be interpreted as if Google published 200 full papers at the two leading AI conferences in 2021.
We will start this analysis with details on methodology, continue on to AI research rankings for 2022, proceed with the changes between recent rankings, then show further interesting charts, and finally discuss whether China is catching up to the United States.
*Previous editions: 2020/2021, 2019/2020, and 2017/2018 pilot
Methodology
The methodology of our Publication Index is inspired by the Nature Index:
To glean a country’s, a region’s or an institution’s contribution to an article, and to ensure they are not counted more than once, the Nature Index uses fractional count (FC), which takes into account the share of authorship on each article. The total FC available per article is 1, which is shared among all authors under the assumption that each contributed equally. For instance, an article with 10 authors means that each author receives an FC of 0.1. For authors who are affiliated with more than one institution, the author’s FC is then split equally between each institution. The total FC for an institution is calculated by summing the FC for individual affiliated authors. The process is similar for countries/regions, although complicated by the fact that some institutions have overseas labs that will be counted towards host country/region totals.
The only difference is that our Publication Index counts overseas labs towards the headquarters country/region (instead of the host country/region). This is a contentious point, but we believe that this approach better reflects the assignment of intellectual property and respective accrual of benefit to the headquarters, rather than the local lab. To make this point explicit, let’s look at DeepMind, an AI research lab located in the UK that Google acquired in 2014. In this analysis, we count papers published by DeepMind towards its current owner, Google, and hence the United States, which might disappoint our friends in the UK. However, given the complexity of locating each author on the map using conference proceedings alone, this was the only consistent treatment of authorship we could find. Let’s hope that conference organizers will make further authorship details available in the future so that we can create two versions of rankings, one based on corporate ownership structure, and the other based on the physical location of the authors.
Here is an example of the Publication Index calculation. If a paper has five authors — three from MIT, one from the University of Oxford, and one from Google — each author will get 1/5th of one point, or 0.2. As a result, from this paper alone, MIT will increase its Publication Index by 3*0.2=0.6 points, the University of Oxford will increase its index by 0.2, and Google will add 0.2. Since MIT is based in the United States, MIT affiliation will increase the Publication Index of the United States by 0.6. Similarly, since the University of Oxford is based in the UK, the EEA + Switzerland + UK region will increase by 0.2. Finally, Google is a multinational corporation headquartered in the United States, therefore the United States will increase its Publication Index by an additional 0.2, for a total increase of 0.8. If an author has multiple affiliations, we split his/her/their fraction across each of those affiliated institutions. For instance, in the case above, if the last author listed two affiliations, Google and Stanford University (instead of just Google), both Google and Stanford University would get additional 0.2/2=0.1 points.
Finally, the reason why we thought it was fair to combine ICML and NeurIPS publications into the same dataset is that they have similar perceived prestige among top AI researchers, similar institutional participation, and similar paper acceptance rates (21.5% for ICML 2021 and 20.1% for NeurIPS 2021).
AI Research Rankings 2022
Top 50 Countries Leading in AI Research in 2022:

1. USA — 1,801.3
2. China — 431.1
3. UK — 189.0
4. Germany — 131.8
5. Canada — 123.4
6. France — 116.3
7. South Korea — 101.1
8. Switzerland — 100.2
9. Israel — 73.1
10. Japan — 62.1
11. Singapore — 46.4
12. Australia — 46.1
13. Netherlands — 33.2
14. India — 31.2
15. Italy — 23.7
16. Russia — 18.9
17. Austria — 18.0
18. Saudi Arabia — 14.1
19. Sweden — 13.0
20. Denmark — 12.3
21. Finland — 10.1
22. Taiwan — 8.5
23. Belgium — 7.1
24. Spain — 6.7
25. Poland — 6.3
26. Vietnam — 5.0
27. UAE — 4.6
28. Chile — 3.7
29. Norway — 3.1
30. Brazil — 2.7
31. Iran — 2.2
32. Greece — 2.2
33. Turkey — 1.8
34. New Zealand — 1.6
35. Pakistan — 1.3
36. Romania — 1.3
37. Thailand — 1.2
38. Hungary — 1.1
39. Croatia — 1.0
40. Ireland — 0.7
41. Colombia — 0.5
42. Mexico — 0.5
43. Luxembourg — 0.5
44. Czechia — 0.5
45. Serbia — 0.3
46. Malaysia — 0.3
47. Uruguay — 0.3
48. Costa Rica — 0.2
49. Portugal — 0.1
50. Iceland — 0.1
Top 100 Global Organizations (Industry & Academia) Leading in AI Research in 2022:
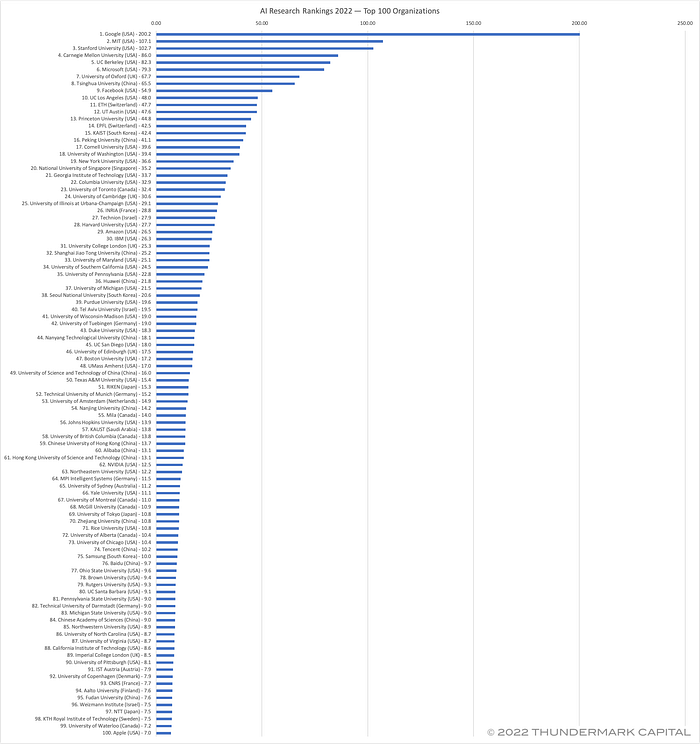
1. Google (USA) — 200.2
2. MIT (USA) — 107.1
3. Stanford University (USA) — 102.7
4. Carnegie Mellon University (USA) — 86.0
5. UC Berkeley (USA) — 82.3
6. Microsoft (USA) — 79.3
7. University of Oxford (UK) — 67.7
8. Tsinghua University (China) — 65.5
9. Facebook (USA) — 54.9
10. UC Los Angeles (USA) — 48
11. ETH (Switzerland) — 47.7
12. UT Austin (USA) — 47.6
13. Princeton University (USA) — 44.8
14. EPFL (Switzerland) — 42.5
15. KAIST (South Korea) — 42.4
16. Peking University (China) — 41.1
17. Cornell University (USA) — 39.6
18. University of Washington (USA) — 39.4
19. New York University (USA) — 36.6
20. National University of Singapore (Singapore) — 35.2
21. Georgia Institute of Technology (USA) — 33.7
22. Columbia University (USA) — 32.9
23. University of Toronto (Canada) — 32.4
24. University of Cambridge (UK) — 30.6
25. University of Illinois at Urbana-Champaign (USA) — 29.1
26. INRIA (France) — 28.8
27. Technion (Israel) — 27.9
28. Harvard University (USA) — 27.7
29. Amazon (USA) — 26.5
30. IBM (USA) — 26.3
31. University College London (UK) — 25.3
32. Shanghai Jiao Tong University (China) — 25.2
33. University of Maryland (USA) — 25.1
34. University of Southern California (USA) — 24.5
35. University of Pennsylvania (USA) — 22.8
36. Huawei (China) — 21.8
37. University of Michigan (USA) — 21.5
38. Seoul National University (South Korea) — 20.6
39. Purdue University (USA) — 19.6
40. Tel Aviv University (Israel) — 19.5
41. University of Wisconsin-Madison (USA) — 19
42. University of Tuebingen (Germany) — 19.0
43. Duke University (USA) — 18.3
44. Nanyang Technological University (Singapore) — 18.1
45. UC San Diego (USA) — 18.0
46. University of Edinburgh (UK) — 17.5
47. Boston University (USA) — 17.2
48. UMass Amherst (USA) — 17.0
49. University of Science and Technology of China (China) — 16.0
50. Texas A&M University (USA) — 15.4
51. RIKEN (Japan) — 15.3
52. Technical University of Munich (Germany) — 15.2
53. University of Amsterdam (Netherlands) — 14.9
54. Nanjing University (China) — 14.2
55. Mila (Canada) — 14.0
56. Johns Hopkins University (USA) — 13.9
57. KAUST (Saudi Arabia) — 13.8
58. University of British Columbia (Canada) — 13.8
59. Chinese University of Hong Kong (China) — 13.7
60. Alibaba (China) — 13.1
61. Hong Kong University of Science and Technology (China) — 13.1
62. NVIDIA (USA) — 12.5
63. Northeastern University (USA) — 12.2
64. MPI Intelligent Systems (Germany) — 11.5
65. University of Sydney (Australia) — 11.2
66. Yale University (USA) — 11.1
67. University of Montreal (Canada) — 11.0
68. McGill University (Canada) — 10.9
69. University of Tokyo (Japan) — 10.8
70. Zhejiang University (China) — 10.8
71. Rice University (USA) — 10.8
72. University of Alberta (Canada) — 10.4
73. University of Chicago (USA) — 10.4
74. Tencent (China) — 10.2
75. Samsung (South Korea) — 10.0
76. Baidu (China) — 9.7
77. Ohio State University (USA) — 9.6
78. Brown University (USA) — 9.4
79. Rutgers University (USA) — 9.3
80. UC Santa Barbara (USA) — 9.1
81. Pennsylvania State University (USA) — 9.0
82. Technical University of Darmstadt (Germany) — 9.0
83. Michigan State University (USA) — 9.0
84. Chinese Academy of Sciences (China) — 9.0
85. Northwestern University (USA) — 8.9
86. University of North Carolina (USA) — 8.7
87. University of Virginia (USA) — 8.7
88. California Institute of Technology (USA) — 8.6
89. Imperial College London (UK) — 8.5
90. University of Pittsburgh (USA) — 8.1
91. IST Austria (Austria) — 7.9
92. University of Copenhagen (Denmark) — 7.9
93. CNRS (France) — 7.7
94. Aalto University (Finland) — 7.6
95. Fudan University (China) — 7.6
96. Weizmann Institute (Israel) — 7.5
97. NTT (Japan) — 7.5
98. KTH Royal Institute of Technology (Sweden) — 7.5
99. University of Waterloo (Canada) — 7.2
100. Apple (USA) — 7.0
Top 100 American Universities Leading in AI Research in 2022:

1. MIT — 107.1
2. Stanford University — 102.7
3. Carnegie Mellon University — 86.0
4. UC Berkeley — 82.3
5. UC Los Angeles — 48.0
6. UT Austin — 47.6
7. Princeton University — 44.8
8. Cornell University — 39.6
9. University of Washington — 39.4
10. New York University — 36.6
11. Georgia Institute of Technology — 33.7
12. Columbia University — 32.9
13. University of Illinois at Urbana-Champaign — 29.1
14. Harvard University — 27.7
15. University of Maryland — 25.1
16. University of Southern California — 24.5
17. University of Pennsylvania — 22.8
18. University of Michigan — 21.5
19. Purdue University — 19.6
20. University of Wisconsin-Madison — 19.0
21. Duke University — 18.3
22. UC San Diego — 18.0
23. Boston University — 17.2
24. UMass Amherst — 17.0
25. Texas A&M University — 15.4
26. Johns Hopkins University — 13.9
27. Northeastern University — 12.2
28. Yale University — 11.1
29. Rice University — 10.8
30. University of Chicago — 10.4
31. Ohio State University — 9.6
32. Brown University — 9.4
33. Rutgers University — 9.3
34. UC Santa Barbara — 9.1
35. Pennsylvania State University — 9.0
36. Michigan State University — 9.0
37. Northwestern University — 8.9
38. University of North Carolina — 8.7
39. University of Virginia — 8.7
40. California Institute of Technology — 8.6
41. University of Pittsburgh — 8.1
42. UC Santa Cruz — 6.6
43. Toyota Technological Institute at Chicago — 6.5
44. University of Utah — 6.4
45. UT Dallas — 6.0
46. UC Irvine — 6.0
47. University of Illinois at Chicago — 5.9
48. UW Madison — 5.4
49. Allen Institute — 5.3
50. UC Davis — 5.2
51. Washington University in St. Louis — 5.1
52. Rensselaer Polytechnic Institute — 5.1
53. Oregon State University — 5.1
54. Indiana University — 4.8
55. Stevens Institute of Technology — 4.8
56. University of Minnesota — 4.7
57. Virginia Tech — 4.2
58. SUNY Buffalo — 3.9
59. University of Colorado — 3.9
60. Lawrence Livermore National Laboratory — 3.8
61. UC Riverside — 3.6
62. Dartmouth College — 3.4
63. North Carolina State University — 3.2
64. Iowa State University — 3.1
65. University of Iowa — 3.1
66. Arizona State University — 3.0
67. Tufts University — 2.6
68. Syracuse University — 2.5
69. Los Alamos National Laboratory — 2.3
70. Emory University — 2.3
71. University of Central Florida — 2.3
72. George Mason University — 2.2
73. UC Merced — 2.2
74. Worcester Polytechnic Institute — 2.2
75. University of Rochester — 2.2
76. Auburn University — 2.1
77. Florida State University — 2.0
78. University of Florida — 2.0
79. Washington State University — 2.0
80. Rochester Institute of Technology — 2.0
81. Stony Brook University — 1.9
82. University of Oregon — 1.5
83. SUNY Albany — 1.4
84. Lehigh University — 1.4
85. Courant Institute — 1.4
86. University of Delaware — 1.3
87. University of Arizona — 1.3
88. University of Memphis — 1.2
89. University at Buffalo — 1.1
90. University of Columbia — 1.1
91. University of Kentucky — 1.0
92. University of Tennessee — 1.0
93. City University of New York — 1.0
94. Carleton University — 1.0
95. Argonne National Laboratory — 1.0
96. Brigham Young University — 1.0
97. University of Connecticut — 1.0
98. Virginia Commonwealth University — 1.0
99. Pacific Northwest National Laboratory — 0.9
100. Baylor College of Medicine — 0.9
Top 100 Global Universities Leading in AI Research in 2022:
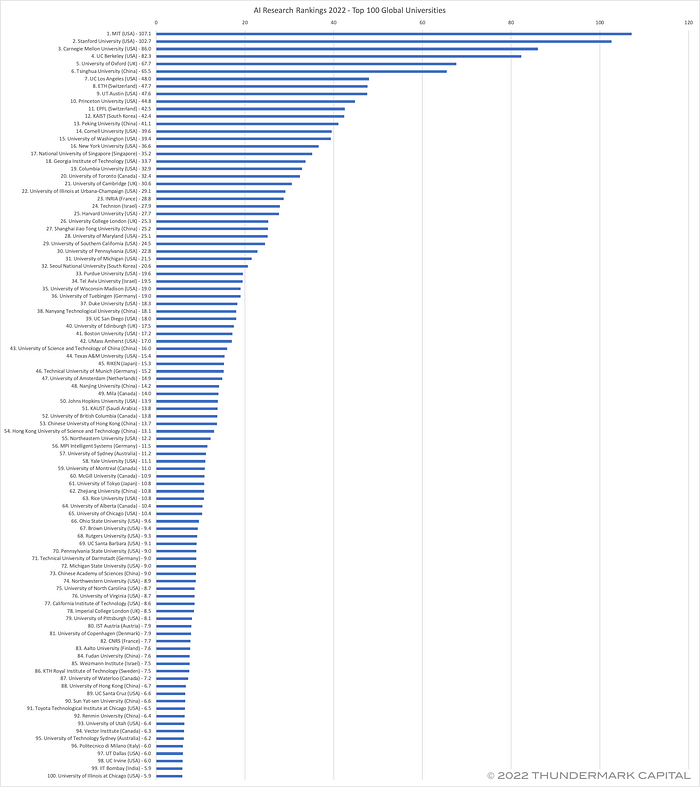
1. MIT (USA) — 107.1
2. Stanford University (USA) — 102.7
3. Carnegie Mellon University (USA) — 86.0
4. UC Berkeley (USA) — 82.3
5. University of Oxford (UK) — 67.7
6. Tsinghua University (China) — 65.5
7. UC Los Angeles (USA) — 48.0
8. ETH (Switzerland) — 47.7
9. UT Austin (USA) — 47.6
10. Princeton University (USA) — 44.8
11. EPFL (Switzerland) — 42.5
12. KAIST (South Korea) — 42.4
13. Peking University (China) — 41.1
14. Cornell University (USA) — 39.6
15. University of Washington (USA) — 39.4
16. New York University (USA) — 36.6
17. National University of Singapore (Singapore) — 35.2
18. Georgia Institute of Technology (USA) — 33.7
19. Columbia University (USA) — 32.9
20. University of Toronto (Canada) — 32.4
21. University of Cambridge (UK) — 30.6
22. University of Illinois at Urbana-Champaign (USA) — 29.1
23. INRIA (France) — 28.8
24. Technion (Israel) — 27.9
25. Harvard University (USA) — 27.7
26. University College London (UK) — 25.3
27. Shanghai Jiao Tong University (China) — 25.2
28. University of Maryland (USA) — 25.1
29. University of Southern California (USA) — 24.5
30. University of Pennsylvania (USA) — 22.8
31. University of Michigan (USA) — 21.5
32. Seoul National University (South Korea) — 20.6
33. Purdue University (USA) — 19.6
34. Tel Aviv University (Israel) — 19.5
35. University of Wisconsin-Madison (USA) — 19.0
36. University of Tuebingen (Germany) — 19.0
37. Duke University (USA) — 18.3
38. Nanyang Technological University (Singapore) — 18.1
39. UC San Diego (USA) — 18.0
40. University of Edinburgh (UK) — 17.5
41. Boston University (USA) — 17.2
42. UMass Amherst (USA) — 17.0
43. University of Science and Technology of China (China) — 16.0
44. Texas A&M University (USA) — 15.4
45. RIKEN (Japan) — 15.3
46. Technical University of Munich (Germany) — 15.2
47. University of Amsterdam (Netherlands) — 14.9
48. Nanjing University (China) — 14.2
49. Mila (Canada) — 14.0
50. Johns Hopkins University (USA) — 13.9
51. KAUST (Saudi Arabia) — 13.8
52. University of British Columbia (Canada) — 13.8
53. Chinese University of Hong Kong (China) — 13.7
54. Hong Kong University of Science and Technology (China) — 13.1
55. Northeastern University (USA) — 12.2
56. MPI Intelligent Systems (Germany) — 11.5
57. University of Sydney (Australia) — 11.2
58. Yale University (USA) — 11.1
59. University of Montreal (Canada) — 11.0
60. McGill University (Canada) — 10.9
61. University of Tokyo (Japan) — 10.8
62. Zhejiang University (China) — 10.8
63. Rice University (USA) — 10.8
64. University of Alberta (Canada) — 10.4
65. University of Chicago (USA) — 10.4
66. Ohio State University (USA) — 9.6
67. Brown University (USA) — 9.4
68. Rutgers University (USA) — 9.3
69. UC Santa Barbara (USA) — 9.1
70. Pennsylvania State University (USA) — 9.0
71. Technical University of Darmstadt (Germany) — 9.0
72. Michigan State University (USA) — 9.0
73. Chinese Academy of Sciences (China) — 9.0
74. Northwestern University (USA) — 8.9
75. University of North Carolina (USA) — 8.7
76. University of Virginia (USA) — 8.7
77. California Institute of Technology (USA) — 8.6
78. Imperial College London (UK) — 8.5
79. University of Pittsburgh (USA) — 8.1
80. IST Austria (Austria) — 7.9
81. University of Copenhagen (Denmark) — 7.9
82. CNRS (France) — 7.7
83. Aalto University (Finland) — 7.6
84. Fudan University (China) — 7.6
85. Weizmann Institute (Israel) — 7.5
86. KTH Royal Institute of Technology (Sweden) — 7.5
87. University of Waterloo (Canada) — 7.2
88. University of Hong Kong (China) — 6.7
89. UC Santa Cruz (USA) — 6.6
90. Sun Yat-sen University (China) — 6.6
91. Toyota Technological Institute at Chicago (USA) — 6.5
92. Renmin University (China) — 6.4
93. University of Utah (USA) — 6.4
94. Vector Institute (Canada) — 6.3
95. University of Technology Sydney (Australia) — 6.2
96. Politecnico di Milano (Italy) — 6.0
97. UT Dallas (USA) — 6.0
98. UC Irvine (USA) — 6.0
99. IIT Bombay (India) — 5.9
100. University of Illinois at Chicago (USA) — 5.9
Top 100 Global Companies Leading in AI Research in 2022:
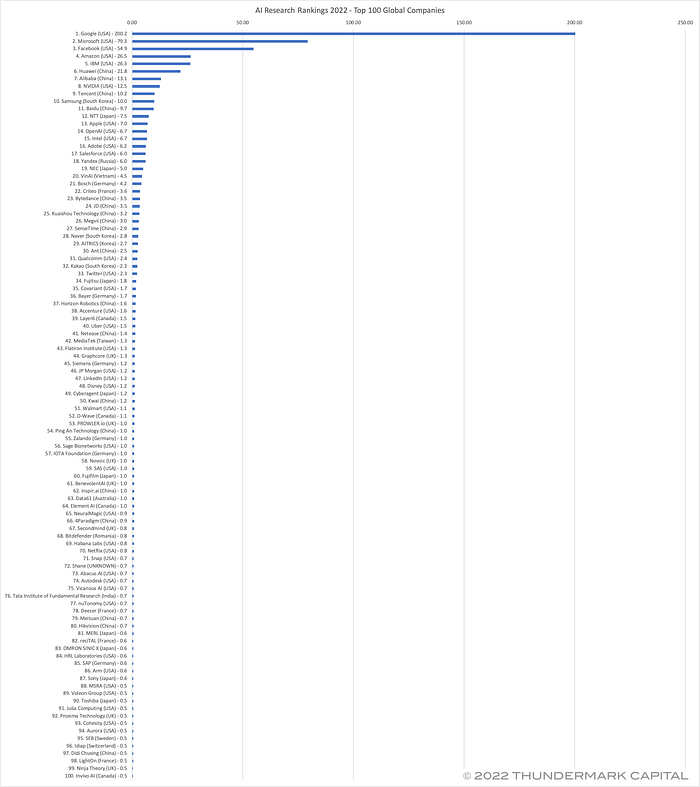
1. Google (USA) — 200.2
2. Microsoft (USA) — 79.3
3. Facebook (USA) — 54.9
4. Amazon (USA) — 26.5
5. IBM (USA) — 26.3
6. Huawei (China) — 21.8
7. Alibaba (China) — 13.1
8. NVIDIA (USA) — 12.5
9. Tencent (China) — 10.2
10. Samsung (South Korea) — 10.0
11. Baidu (China) — 9.7
12. NTT (Japan) — 7.5
13. Apple (USA) — 7
14. OpenAI (USA) — 6.7
15. Intel (USA) — 6.7
16. Adobe (USA) — 6.2
17. Salesforce (USA) — 6.0
18. Yandex (Russia) — 6.0
19. NEC (Japan) — 5.0
20. VinAI (Vietnam) — 4.5
21. Bosch (Germany) — 4.2
22. Criteo (France) — 3.6
23. Bytedance (China) — 3.5
24. JD (China) — 3.5
25. Kuaishou Technology (China) — 3.2
26. Megvii (China) — 3.0
27. SenseTime (China) — 2.9
28. Naver (South Korea) — 2.8
29. AITRICS (South Korea) — 2.7
30. Ant (China) — 2.5
31. Qualcomm (USA) — 2.4
32. Kakao (South Korea) — 2.3
33. Twitter (USA) — 2.3
34. Fujitsu (Japan) — 1.8
35. Covariant (USA) — 1.7
36. Bayer (Germany) — 1.7
37. Horizon Robotics (China) — 1.6
38. Accenture (USA) — 1.6
39. Layer6 (Canada) — 1.5
40. Uber (USA) — 1.5
41. Netease (China) — 1.4
42. MediaTek (Taiwan) — 1.3
43. Flatiron Institute (USA) — 1.3
44. Graphcore (UK) — 1.3
45. Siemens (Germany) — 1.2
46. JP Morgan (USA) — 1.2
47. LinkedIn (USA) — 1.2
48. Disney (USA) — 1.2
49. Cyberagent (Japan) — 1.2
50. Kwai (China) — 1.2
51. Walmart (USA) — 1.1
52. D-Wave (Canada) — 1.1
53. PROWLER.io (UK) — 1.0
54. Ping An Technology (China) — 1.0
55. Zalando (Germany) — 1.0
56. Sage Bionetworks (USA) — 1.0
57. IOTA Foundation (Germany) — 1.0
58. Novoic (UK) — 1.0
59. SAS (USA) — 1.0
60. Fujifilm (Japan) — 1.0
61. BenevolentAI (UK) — 1.0
62. inspir.ai (China) — 1.0
63. Data61 (Australia) — 1.0
64. Element AI (Canada) — 1.0
65. NeuralMagic (USA) — 0.9
66. 4Paradigm (China) — 0.9
67. Secondmind (UK) — 0.8
68. Bitdefender (Romania) — 0.8
69. Habana Labs (USA) — 0.8
70. Netflix (USA) — 0.8
71. Snap (USA) — 0.7
72. Shane — 0.7
73. Abacus.AI (USA) — 0.7
74. Autodesk (USA) — 0.7
75. Vicarious AI (USA) — 0.7
76. Tata Institute of Fundamental Research (India) — 0.7
77. nuTonomy (USA) — 0.7
78. Deezer (France) — 0.7
79. Meituan (China) — 0.7
80. Hikvision (China) — 0.7
81. MERL (Japan) — 0.6
82. reciTAL (France) — 0.6
83. OMRON SINIC X (Japan) — 0.6
84. HRL Laboratories (USA) — 0.6
85. SAP (Germany) — 0.6
86. Arm (USA) — 0.6
87. Sony (Japan) — 0.6
88. MSRA (USA) — 0.5
89. Voleon Group (USA) — 0.5
90. Toshiba (Japan) — 0.5
91. Julia Computing (USA) — 0.5
92. Proxima Technology (UK) — 0.5
93. Cohesity (USA) — 0.5
94. Aurora (USA) — 0.5
95. SEB (Sweden) — 0.5
96. Idiap (Switzerland) — 0.5
97. Didi Chuxing (China) — 0.5
98. LightOn (France) — 0.5
99. Ninja Theory (UK) — 0.5
100. Invivo AI (Canada) — 0.5
Changes in AI Rankings*
Changes in Publication Index of Top 10 Countries:
2020:
1. USA — 1260.2
2. China — 184.5
3. UK — 126.1
4. France — 94.3
5. Canada — 80.3
6. Germany — 64.5
7. Switzerland — 59.3
8. Japan — 49.4
9. South Korea — 46.8
10. Israel — 43.3
2021:
1. USA — 1677.8 [+33% vs 2020]
2. China — 281.2 [+52%]
3. UK — 161.0 [+28%]
4. Canada — 114.5 [+42%]
5. France — 102.9 [+9%]
6. Germany — 91.5 [+42%]
7. Switzerland — 86.7 [+46%]
8. South Korea — 76.6 [+64%]
9. Japan — 57.8 [+17%]
10. Israel — 57.7 [+33%]
2022:
1. USA — 1801.3 [+7% vs 2021]
2. China — 431.1 [+53%]
3. UK — 189.0 [+17%]
4. Germany — 131.8 [+44%]
5. Canada — 123.4 [+8%]
6. France — 116.3 [+13%]
7. South Korea — 101.1 [+32%]
8. Switzerland — 100.2 [+16%]
9. Israel — 73.1 [+27%]
10. Japan — 62.1 [+7%]
Changes in Publication Index of Top 10 Global Organizations:
2020:
1. Google (USA) — 167.3
2. Stanford University (USA)— 82.3
3. MIT (USA)— 69.8
4. Carnegie Mellon University (USA)— 67.7
5. UC Berkeley (USA)— 53.9
6. Microsoft (USA)— 51.9
7. University of Oxford (UK) — 36.2
8. Facebook (USA) — 33.1
9. Princeton University (USA)— 31.5
10. Cornell University (USA) — 30.9
2021:
1. Google (USA) — 220.1 [+32% vs 2020]
2. Stanford University (USA) — 106.1 [+29%]
3. MIT (USA) — 99.6 [+43%]
4. UC Berkeley (USA) — 86.7 [+61%]
5. Carnegie Mellon University (USA) — 71.3 [+5%]
6. Microsoft (USA) — 66.5 [+28%]
7. University of Oxford (UK) — 51.9 [+43%]
8. Facebook (USA) — 48.5 [+46%]
9. Tsinghua University (China) — 46.8 [+65%]
10. Princeton University (USA) — 45.0 [+43%]
2022:
1. Google (USA) — 200.2 [-9% vs 2021]
2. MIT (USA) — 107.1 [+8%]
3. Stanford University (USA) — 102.7 [-3%]
4. Carnegie Mellon University (USA) — 86.0 [+21%]
5. UC Berkeley (USA) — 82.3 [-5%]
6. Microsoft (USA) — 79.3 [+19%]
7. University of Oxford (UK) — 67.7 [+30%]
8. Tsinghua University (China) — 65.5 [+40%]
9. Facebook (USA) — 54.9 [+13%]
10. UC Los Angeles (USA) — 48.0 [+45%]
Discussion
As you can see, over the last two years China made a massive research push in AI and increased its Publication Index by 52% and 53% each year— a very impressive achievement, considering how competitive ICML and NeurIPS conferences are. As a result, China’s top school, Tsinghua University, propelled itself from rank #15 two years ago to #8 today, ahead of such formidable “competitors” as Facebook, UCLA, ETH, EPFL, Princeton, and UT Austin. Peking University, another top Chinese university, is breathing down Tsinghua’s back, with the Publication Index lagging a year or two behind (currently at #16).
Another big improvement came from Germany, which increased its Publication index by 42% and 44% over each of the last two years. We don’t see any particular star university or company to account for it (the top German “competitor” is the University of Tuebingen ranked #42), but rather the increase is spread across Germany’s impressive (and geographically distributed) Max Planck Institutes and Technical Universities.
In addition, South Korea improved its Publication Index by 64% and 32% over each of the last two years. Its intellectual brainpower in AI research is now matching (and slightly exceeding) that of Switzerland. As an aside, South Korea’s regional neighbor, Singapore (not in our Top 10 yet), has put up an amazing performance and increased its Publication Index by 128% and 55% over the last two years, and is currently ranked at #11. At this rate, it might catch up to Japan (#10) in only a couple of years.
Finally, you might notice that just like in Lewis Carroll’s Red Queen’s race, top organizations need to publish significantly more papers each year just to maintain the lead:
“My dear, here we must run as fast as we can, just to stay in place. And if you wish to go anywhere you must run twice as fast as that.”
*Previous editions: 2020/2021, 2019/2020, and 2017/2018 pilot
Further Analysis
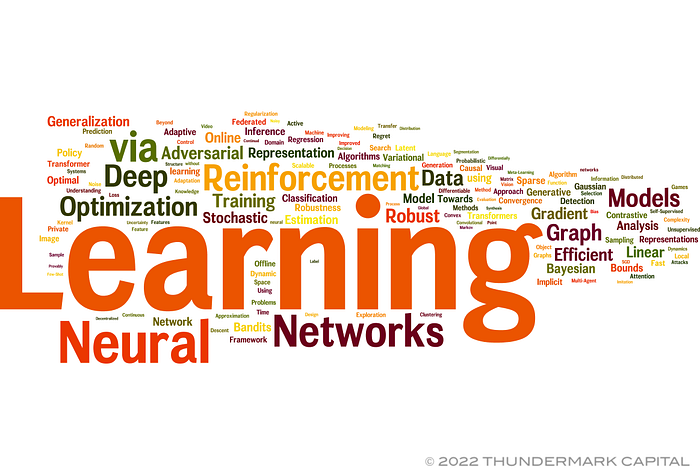
Word Cloud of Paper Titles:
Academia vs. Industry — Share of Total Publication Index:
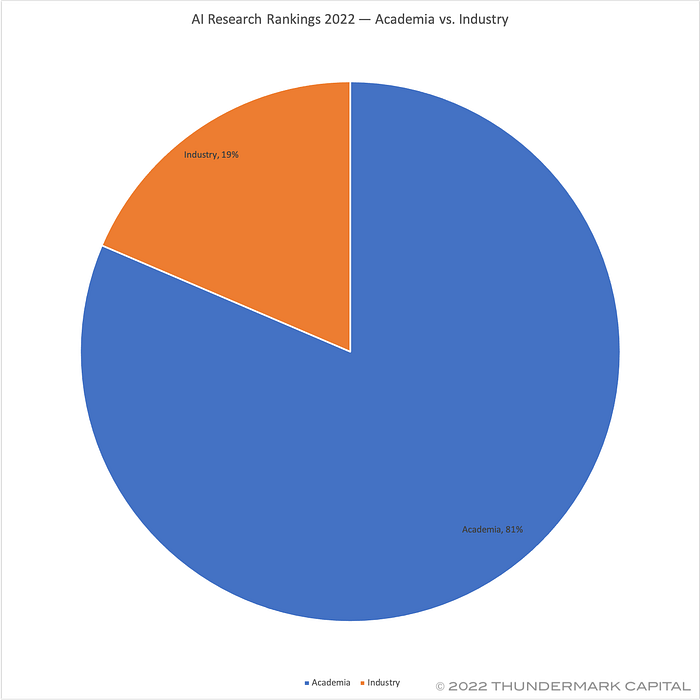
Academia — 81%
Industry — 19%
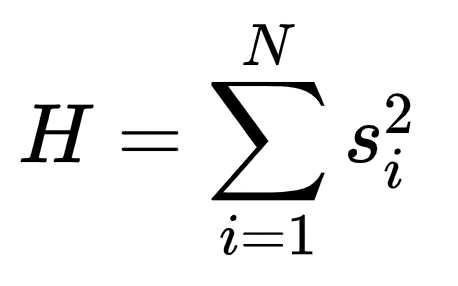
Measuring Competition in AI Research (the Herfindahl Index):
The Herfindahl index (also known as Herfindahl–Hirschman Index) is a measure of the size of participants in relation to the industry and an indicator of the amount of competition among them:
Interpretation:
- An H below 100 indicates a highly competitive industry.
- An H below 1,500 indicates an unconcentrated industry.
- An H between 1,500 to 2,500 indicates moderate concentration.
- An H above 2,500 indicates a high concentration.
We can calculate the Herfindahl index in two ways: by country and by the organization. The former illustrates whether AI research is “monopolized” by any country and the latter shows “monopolization” by any organization.
Herfindahl index by country:
2019: H = 3,434
2020: H = 3,366
2021: H = 2,963
The latest H=2,963 still indicates a highly-concentrated industry. H has been decreasing since 2019, so AI research is getting more competitive (less monopolized) at the country level.
Herfindahl index by organization:
2019: H = 146
2020: H = 142
2021: H = 116
The latest H=116 indicates a non-concentrated industry. H has been decreasing since 2019, so AI research is getting more competitive (less monopolized) at the organization level.
Sputnik Moment for China?
A heated debate is going on today on the state of the strategic race between the United States and China to dominate in AI. We tend to side with a more balanced perspective, but before we begin our analysis, a bit of recent history is in order (some of this will look familiar to the regular readers of our AI research rankings).
Two major events happened in AI in 2016: first, Google’s AlphaGo became the first computer program to beat a 9-dan Go professional, Lee Sedol, without handicaps; second, President Obama’s administration released a strategy on future directions and considerations for AI called Preparing for the Future of Artificial Intelligence. In China, these two events created a “Sputnik moment” which helped convince the Chinese government to prioritize and dramatically increase funding for artificial intelligence (see Kai-Fu Lee’s AI Superpowers).
In response, in 2017 the Communist Party of China set 2030 as the deadline for an ambitious AI goal: it called for China to reach the top tier of AI economies by 2020, achieve major new breakthroughs by 2025, and become the global leader in AI by 2030. The strategy became known as the New Generation Artificial Intelligence Development Plan, and it has spurred many policies and billions of dollars of investment in research and development from ministries, provincial governments, and private companies.
Certain think tanks, such as CNAS, argued that China’s AI strategy reflected the key principles from the Obama administration report — now it was China adopting them, instead of the United States. This copying strategy isn’t new: to quote Peter Thiel’s Zero to One, “The Chinese have been straightforwardly copying everything that has worked in the developed world: 19th-century railroads, 20th-century air conditioning, and even entire cities. They might skip a few steps along the way — going straight to wireless without installing landlines, for instance — but they’re copying all the same.”
As a result of this concerted effort by China, the American advantage in AI has been disappearing quickly: in 2017 the United States had an 11x lead over China (source); by 2019 the United States was down to a 7x lead (source); in 2020 the United States was left with a 6x lead (source); as we write this in 2022, the United States has a 4x lead (see above). Furthermore, the Allen Institute for Artificial Intelligence analysis found that China steadily increased its share of authorship of the top 10% of most-cited papers.
One might say that it is not looking good for American competitiveness in AI in the next decade. However, we believe that the outcome will depend on the interplay of the advancement of three key ingredients of modern AI: algorithms, hardware, and training data, and it takes getting all three right in order to dominate the field.
We believe that the United States will have a strong lead in AI algorithms over the next few years, grounded in several decades of the advancement of computer science at world-class universities, such as MIT, Stanford, CMU, and UC Berkeley. In addition, the openness of the companies, such as Google and Facebook, to publishing internal research at AI conferences created a thriving ecosystem for top AI researchers, who now move seamlessly between academia and industry.
In addition, the United States is the home of Silicon Valley in its original silicon-focused definition, which has been at the forefront of hardware innovation. We think that it will be extremely difficult for China to catch up to the United States in advanced microprocessor technology over the next five to ten years, especially given the protections by vast patent portfolios held by Intel, AMD, and NVIDIA.
However, the American advantage is questionable when it comes to the availability of training data. Access to data is part of the broader privacy vs. public good debate, where the United States tends to choose the former, and China — the latter. In China today AI scans faces from hundreds of millions of street cameras, reads billions of WeChat messages, and analyzes millions of health records — all following the data-as-a-public-good argument. This training data availability, combined with China’s 1.4B population, creates an enormous strategic advantage for China.
Hard-pressed to draw a conclusion, we still think that the first two factors (algorithms and hardware) will outweigh the last one (availability of data), and the United States will maintain its lead in AI over the next few years. However, and this is the major takeaway from this analysis, the United States needs to wake up to the urgent need to innovate in AI and allocate significant public and private funds to educate undergraduate and graduate students in AI and empower AI research at the top American research universities.
In response to China’s progress, the White House announced a $1 billion research push for AI and quantum computing in response to many policy advisors who worried that America was falling behind in AI and quantum research compared to rivals like China, and warned that these technologies were instrumental not only for economic development but also national security. However, we believe that this number should be closer to the $1 trillion that Mark Cuban proposed to invest in AI and robotics back in 2016. Otherwise, the United States risks losing its strategic advantage in AI to China, just as it did in high-speed rail and space exploration.
Dataset
Please note that even data science conferences still don’t release publication data in any sort of Python-friendly form 🤷♂️, so our analysis ended up being quite manual (i.e. first parse HTML, then fix typos in organization names, standardize them, split lines with multiple organizations per author, summarize with a pivot table, etc.). Please contact us if you see any bugs!
Please subscribe to our Twitter if you’d like to follow our Deep Tech research. 🤖